Interface
by XOCOMP
Prepared week of 2/10/2003
Effort (staff months)
±197%
10.6
Completion Date
4.9 months
±46%
$320,202
Peak Staff (people)
±104%
4.6
Overall Estimate Quality
Fair
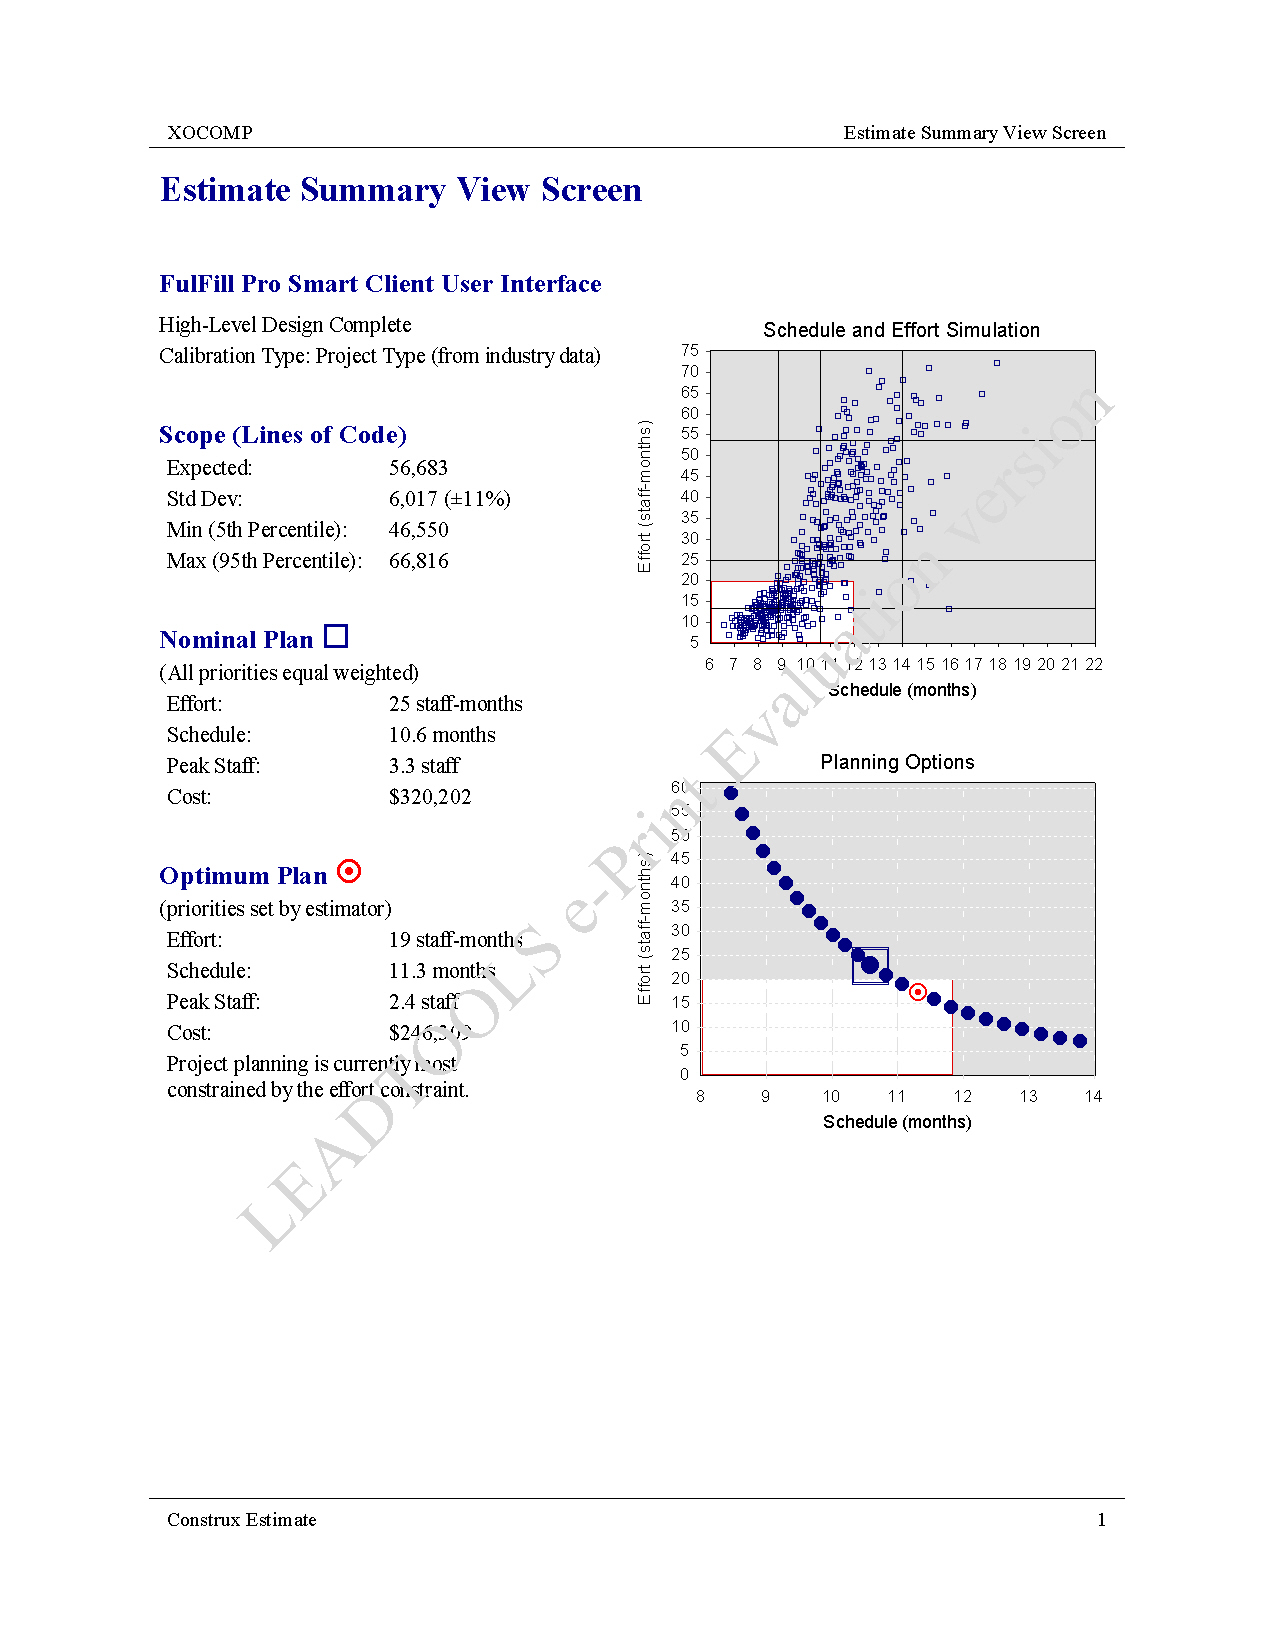
percent chance of underrunning the estimate. This is also known as the "nominal" estimate. This estimate is for the "main
build" phase of a project, the time from detailed requirements specification complete to software acceptance. Earlier
phases of a project are not estimated here.
Effort (staff months)
Schedule (calendar months)
$246,309
Peak Staff (people)
1.7
These planning values meet the project's entire set of constraints and priorities to the maximum extent possible.
Some of these characteristics can be evaluated programmatically.
This report rates the quality of this estimate on a 5 point verbal scale:
• Excellent
• Good
• Fair
Overall quality of this estimate: Fair
historical projects, cost drivers, or project types are less accurate. This estimate has been calibrated using project types.
estimates created with large-granularity units such as classes and subsystems. Scope estimates created on a module-by-
This estimate's type of scope estimate: Basic Size (Classes/Modules)
Scope estimate quality: Good
cannot be very accurate if they are created at a point in the project when comparatively little is known about the software to
be built.
Estimate quality possible in this phase: Very Good
similar sizes and types. The estimated project has a type of "Intranet Systems (internal)" and a subtype of "Business
Systems."
Productivity (lines of code per
Schedule (months)
Within Normal Range
Average Staff (people)
1.7
of code per month)
• Nominal development is expected to last at least 6 months.
• Nominal effort is expected to be at least 18 staff-months.
Even when Historical calibration is used, some projects are too small to estimate reliably. This project uses Project Type
Suitability of Estimate to estimate this project: Excellent
Effort (staff months)
Schedule (calendar
Effort (staff months)
Schedule (calendar
Cost
Cost
Average Staff
2.3
Average Staff
1.7
Effort (staff months)
Schedule (calendar
Effort (staff months)
Schedule (calendar
Cost
Cost
Average Staff
Average Staff
0.6
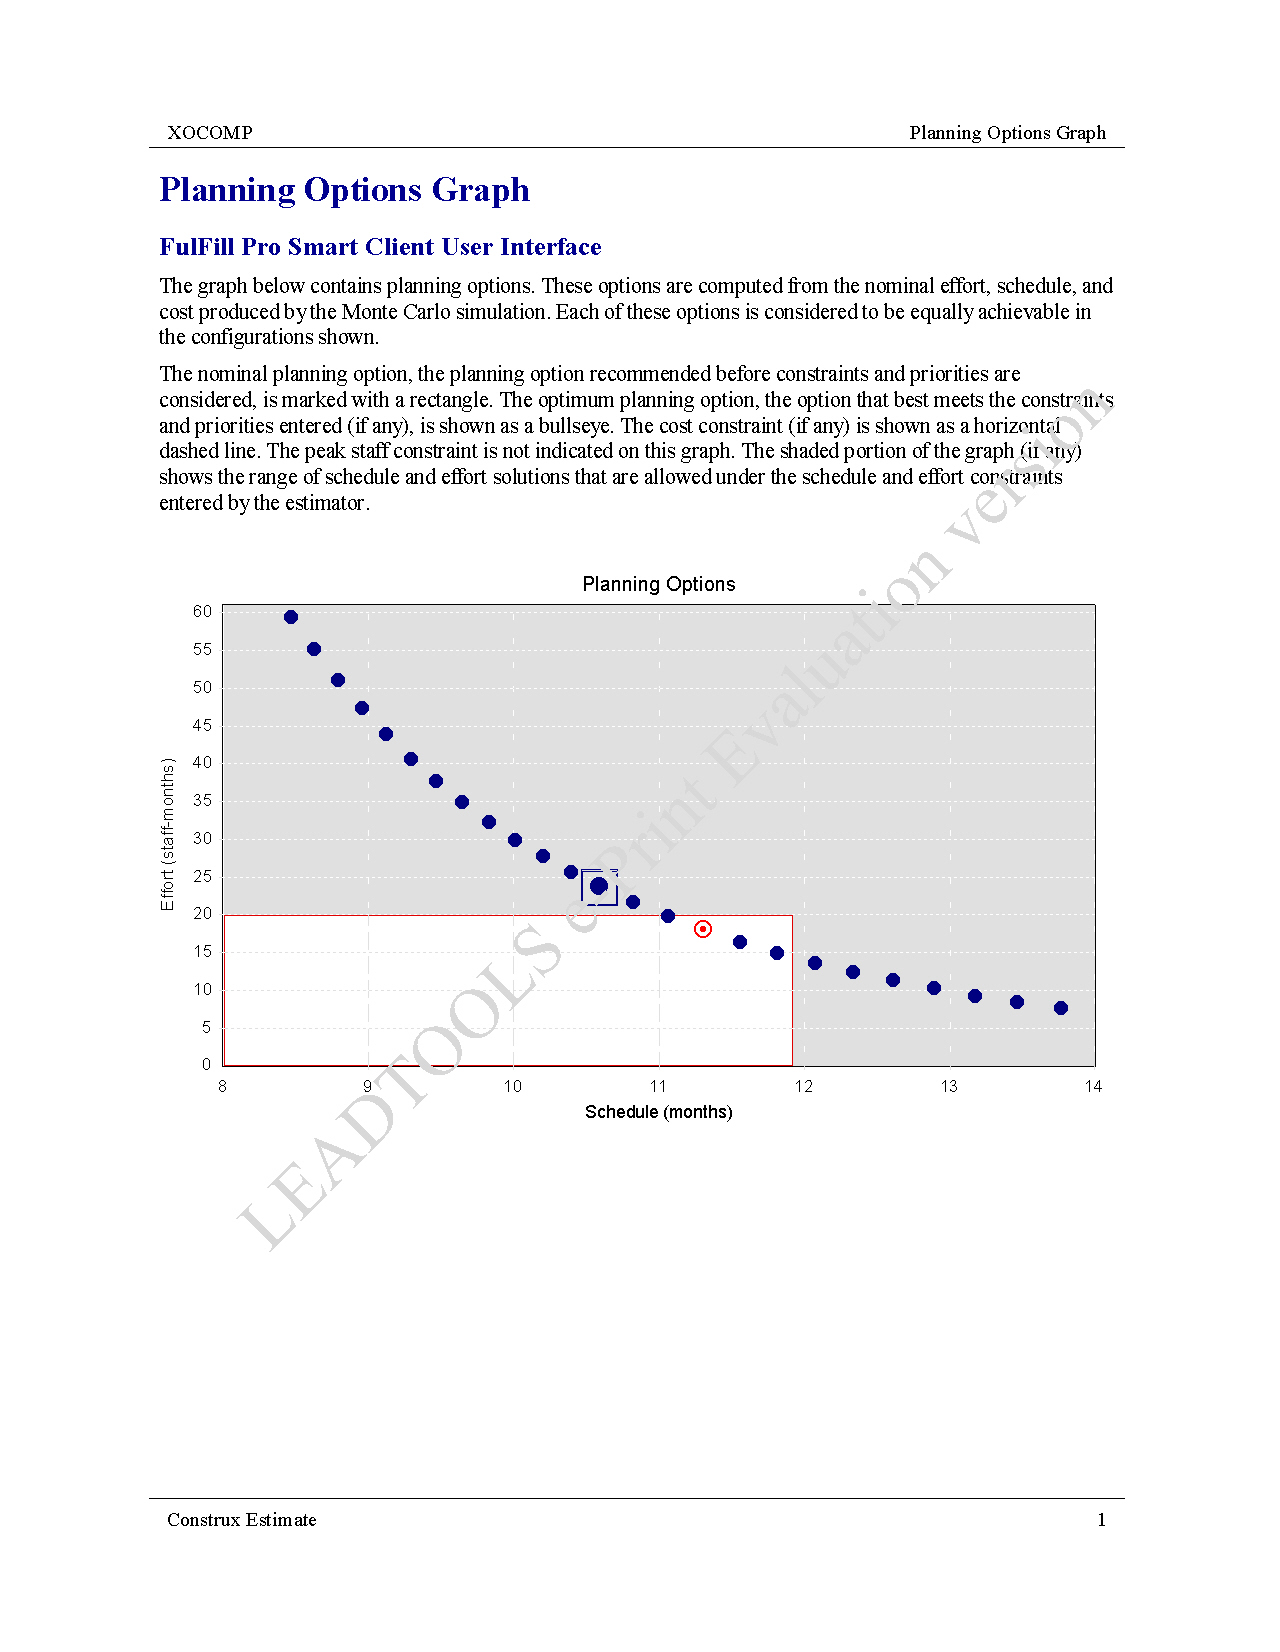
produced by the Monte Carlo simulation. Each of these options is considered to be equally achievable in the configurations
shown. The schedule that best meets the constraints and priorities entered by the estimator (if any) is shown with a shaded
2
8.6
56
$725,707
8.5
4
9.0
48
$625,395
7.0
6
9.3
42
$538,949
5.8
8
9.6
36
$464,452
4.8
31
$400,253
11
10.2
4.0
27
$344,927
13
10.6
3.3
23
$293,389
15
16
11.1
11.3
2.7
2.4
19
$246,309
18
11.8
16
1.9
$206,785
20
12.3
13
1.6
$173,602
22
12.9
11
1.2
$145,745
24
13.5
1.0
$122,358
9
below shows the constraints used to create this estimate.
Maximum Schedule Allowed
12.0 months
Maximum Cost Allowed
Maximum Peak Staff Allowed
n/a
5.0 staff
(MTTD) Allowed
estimate.
Schedule Priority
Effort Priority
High Priority
Low Priority
Peak Staff Priority
Low Priority
Priority
quantitative effect on the estimates produced.
project, that is, the time between detailed requirements specification complete to software acceptance. Dates are not
provided for milestones prior to the project start date.
Feasibility Study / Product Concept
General Requirements Complete
Detailed Requirements / UI Design
High-Level Design Complete
Detailed-Design Complete
Feature Complete / Code Complete
Start of User-Oriented System Test
148
196
7/11/2003
8/28/2003
43%
57%
24%
40%
Development and Test Complete
Software Accepted
344
100%
100%
~35 forms and dialogs
~155 buttons which should directly map to 155 method calls
~40 drop down lists, ~25 appeared to be unique table lookups
~15 grids with an average of
~8 columns defined per grid
~17 label areas
~225 textboxes which will require validation code, unique textboxes were code could be reused was not determined.
~2 tree views with multiple node levels
~35 option buttons which may increase the number of methods due to specific case instances
~45 check boxes which likely equate to conditional logic
The 35 forms can be broken down into 6 complex, ~21 simplex, and ~9 dialogs.
From these forms we derived the figure of 30 base classes with a possible additional class for each of the 25 unique drop down list to give us 55 class modules.
~10 major tabs were identified across the complex forms to indicate a higher order of complexity for the ~6 base classes.
No estimate can be presented on the component interface since we have user interface samples and database structures but no Business Logic Layer to review.
quality assurance staff, and first-level management.
End of Month)
2
3/15/2003
0.8
1
4
5/15/2003
1.5
3
6
7/15/2003
2.0
7
8
2.3
10/14/2003
11/14/2003
13
16
2.4
11
development staff, quality assurance staff, and first-level management.
This is totally subjective because
2
3/15/2003
$7,795.72
$23,148.60
4
5/15/2003
$17,274.83
$61,735.36
6
7/15/2003
$24,737.37
8
$29,495.90
$143,447.64
10/14/2003
11/14/2003
$31,347.16
$205,573.38
11
estimates were not originally expressed by the estimator in lines of code they have been converted to lines of code. The
scope estimates are based on parameters that have been entered by the estimator, including the following:
Project Phase: High-Level Design Complete
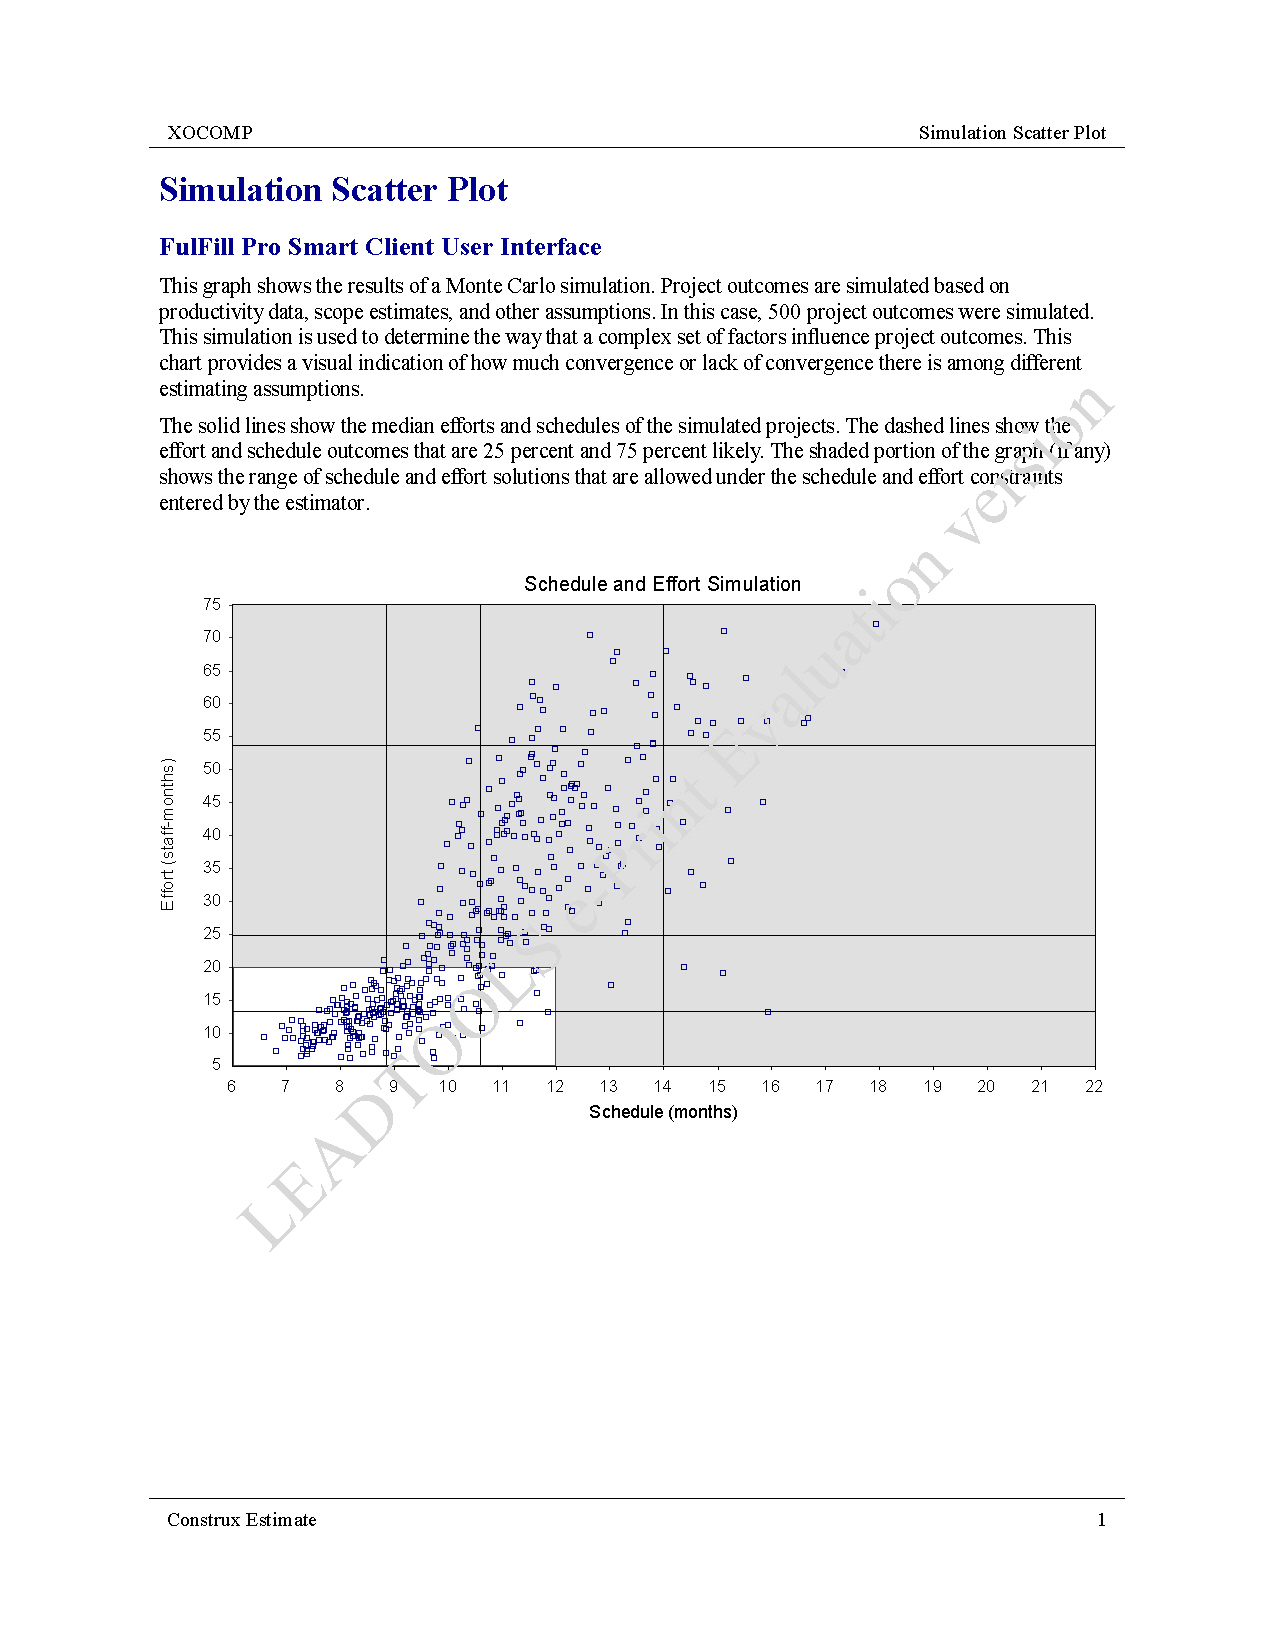
Number of Simulations: 500
41,483
46,550
49,716
5.0
-18%
-12%
20.0
54,150
-4%
40.0
56,683
60.0
4%
61,116
80.0
64,283
13%
95.0
70,616
25%
based on parameters that have been entered by the estimator, including the following:
Project Phase: High-Level Design Complete
Number of Simulations: 500
5.0
8
-66%
20.0
12
-50%
40.0
18
-27%
60.0
32
76%
80.0
70
9,590%
95.0
3,498
19,726%
estimator, including the following: Once again, XOCOMP does not know the
actual PROTOCOL employee/developer cost.
Project Phase: High-Level Design Complete
Number of Simulations: 500
$80,346
5.0
-66%
$125,465
20.0
-50%
$185,901
40.0
-27%
$320,202
60.0
$564,969
$910,270
76%
80.0
9,590%
95.0
$45,199,973
19,726%
They are based on parameters that have been entered by the estimator, including the following:
Project Phase: High-Level Design Complete
Number of Simulations: 500
5.0
7.5
-29%
20.0
8.6
-19%
40.0
9.8
60.0
11.6
23%
44%
80.0
15.3
95.0
55.6
425%
includes business systems, shrinkwrap products, avionics, and many other types. Estimate creates a project estimate by
development across entire industries, estimates created in this way are subject to more variation than estimates created
using other calibration methods.
Project Subtype: Business Systems
(50% Probability)
Deviation
Productivity Index (PI)
2.2
Nominal Manpower Buildup Index (MBI)
-1.6
n/a
Maximum MBI Used in Creating Planning Options
Lines of Code Used to Create Simulation
56,683
6,333
productivity, current project phase, and other parameters
of
different
various project
complex
situations
estimates created
a
uncertainty,
more
accurate
than
created
Estimate
otherwise be impossible to model.
to
create
meaningful
estimates
manual estimation
software
be delivered
lower cost than manual methods do.
software
estimation
model
virtually useless
environment in which it
unless it
is calibrated
tool which employs
sophisticated modeling
Estimate employs
techniques to create accurate software project estimates.
methods,
degrees of estimation accuracy.
The
approaches.
the type
being estimated
by
list
common project
SLIM
includes
shrinkwrap
many other
early 1970s and first offered as a commercial product in
1978. The
creates
productivity
using
for
project
type.
Because
this
Putnam
Excellence" (Yourdon Press, 1992).
co-authored
"Measures for
across
calibration
estimates created using other calibration methods.
method
subject to
more variation
efficiently-run
projects
follow
can be
of exponential
A
equations. These
approach to creating cost, effort, schedule, peak staffing,
equations form
the core
additional
• Cocomo 2.0
parameters include
the
team will
be co-located
geographically
Barry W. Boehm in the 1970s and described in his 1981
facilities),
project is well-known or unprecedented), and personnel
product
attributes
whether
Hall).
below
calibration method is used,
its database of industrywide productivity data.
average,
average,
or
When
this
Estimate again makes use of
Cocomo model and
apply it to projects other than the
originally
extended into Cocomo 2.0, which allows estimates to be
created for
developed.
present,
model
has been
The most
data
completed
organization
perform
project
as a supplement
calibrated using cost
to the SLIM
estimated.
estimating assumptions
approach
through
raft
drivers. A productivity baseline is
affect
personnel
quality,
the
productivity factor
Cocomo 2.0 productivity.
is then
adjusted using
the computed
organization's
effectiveness,
other than historical data
and
on.
calibration
are used, each
Estimate
estimator,
introduces
each
additional
imprecision
project
data
assumptions.
Estimate
simulates
projects, this approach provides accurate estimates with